

























Australia Used Car Market 2026 | Worth USD 217.42 Billion by 2034
Australia used car market size was valued at USD 85.54 Billion in 2025 and is projected to reach USD 217.42 Billion by 2034, exhibiting a CAGR of 10.37% during the forecast period 2026‑2034

Market Overview
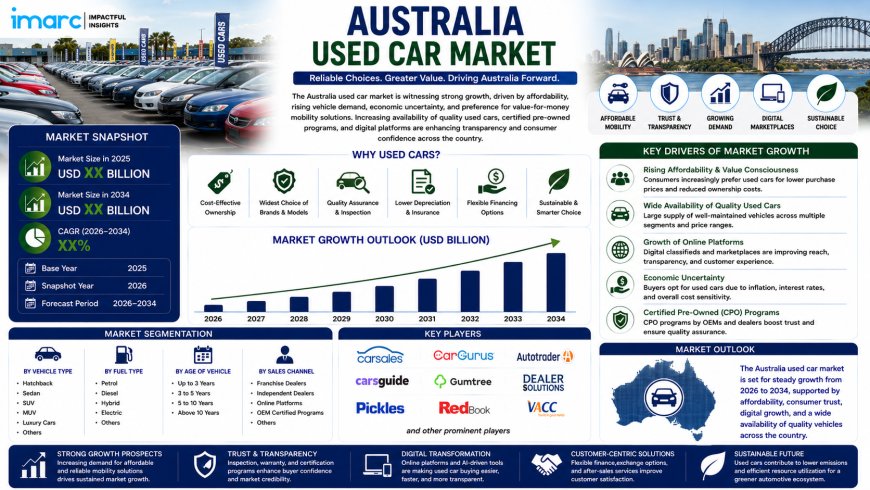
The Australia used car market size was valued at USD 85.54 Billion in 2025 and is projected to reach USD 217.42 Billion by 2034, exhibiting a CAGR of 10.37% during the forecast period 2026‑2034. Rising cost‑of‑living pressures, rapid expansion of digital automotive platforms, and sustained consumer demand for affordable pre‑owned vehicles are the primary growth levers.
This market is strategically important to Australia's automotive and consumer economy, reflecting fundamental shifts in consumer purchasing behaviour. The market recorded USD 52.23 Billion in 2020, affirming more than 63% cumulative growth in the historical period. Digital transformation, growing acceptance of electric and hybrid pre‑owned vehicles, and expanding organised dealer networks will serve as the key structural drivers through 2034.
The Australia used car market is poised for sustained expansion, driven by digital automotive platforms, cost‑of‑living pressures, and growing acceptance of pre‑owned electric vehicles. With a projected CAGR of 10.37% through 2034, the market presents significant opportunities for organised dealers, digital platforms, and EV pre‑owned specialists.
AUSTRALIA USED CAR MARKET SUMMARY
- The Australia used car market encompasses the buying and selling of pre‑owned vehicles across passenger cars, SUVs, and commercial vehicles, facilitated through organised dealerships and digital platforms.
- The ecosystem spans organised dealers, digital automotive marketplaces, private sellers, and financial institutions providing structured financing options.
- Gasoline‑powered vehicles dominate the fuel‑type segmentation at 61.4% share in 2025, supported by broad model availability and established refuelling infrastructure. Diesel vehicles follow at 28.3%, primarily driven by commercial and regional‑use preferences.
- Organised dealers account for 57.2% of transactions, aided by certification programmes, transparent pricing platforms, and structured financing options that build consumer trust. The unorganised segment at 42.8% is gradually ceding share as digital tools formalise private transactions.
- Australian Capital Territory and New South Wales lead with a combined 35.7% share, underpinned by high population density and strong digital platform adoption. Victoria and Tasmania follow at 24.6%, Queensland at 18.9%, Western Australia at 11.0%, and the Northern Territory and Southern Australia at 9.8%.
PORTER'S FIVE FORCES ANALYSIS – AUSTRALIA USED CAR MARKET
The competitive dynamics of the Australia used car market can be analysed using Porter's Five Forces framework.
Bargaining Power of Suppliers – Moderate
- Used car dealers rely on suppliers of vehicles from trade‑ins, fleet sales, and auctions. The growing acceptance of electric and hybrid pre‑owned vehicles is expanding the supplier base, while digital platforms are formalising private transactions.
Bargaining Power of Buyers – Moderate to High
- Australian consumers benefit from extensive choice across organised dealerships and digital platforms. Transparent pricing, certification programmes, and structured financing options strengthen buyer negotiating power. Digital tools are formalising private transactions and increasing price transparency.
Threat of New Entrants – Moderate
- Significant capital requirements for dealership networks and certification programmes create barriers. However, the rapid expansion of digital automotive platforms has enabled new entrants focused on online marketplaces and EV pre‑owned segments.
Threat of Substitutes – Low
- New vehicles represent partial substitutes, but the cost‑of‑living pressures and affordability of pre‑owned vehicles ensure the continued relevance of the used car market.
Competitive Rivalry – High (Healthy)
- The market features competition among organised dealers, digital platforms, and private sellers. Competition is driven by certification programmes, transparent pricing, and financing options.
Request for Sample Report: https://www.imarcgroup.com/australia-used-car-market/requestsample
MARKET GROWTH DRIVERS
Rising Cost‑of‑Living Pressures and Consumer Affordability
Rising cost‑of‑living pressures are driving consumer demand for affordable pre‑owned vehicles, as households seek to manage transportation costs without compromising on mobility. The market recorded USD 52.23 Billion in 2020, affirming more than 63% cumulative growth in the historical period, reflecting sustained consumer preference for used vehicles.
Rapid Expansion of Digital Automotive Platforms
The rapid expansion of digital automotive platforms is transforming the used car market by enabling transparent pricing, certification programmes, and structured financing options. Digital tools are formalising private transactions and increasing consumer trust, driving the organised dealer segment's growth to 57.2% of transactions in 2025.
Growing Acceptance of Electric and Hybrid Pre‑Owned Vehicles
Growing acceptance of electric and hybrid pre‑owned vehicles is expanding the addressable market. As EV adoption increases, the pre‑owned EV segment presents significant opportunities for organised dealers and digital platforms.
AUSTRALIA USED CAR MARKET SEGMENTATION
Segmentation analysis provides a detailed view of the Australia used car market by category:
- Vehicle Type Insights: Various vehicle types.
- Vendor Type Insights: Organised (57.2% share in 2025), Unorganised (42.8% share).
- Fuel Type Insights: Gasoline (61.4% share in 2025), Diesel (28.3% share), Others.
- Sales Channel Insights: Various sales channels.
- Regional Insights: Australia Capital Territory & New South Wales (35.7% share), Victoria & Tasmania (24.6% share), Queensland (18.9% share), Western Australia (11.0% share), Northern Territory & Southern Australia (9.8% share).
COMPETITIVE LANDSCAPE
The competitive landscape of the Australia used car market features organised dealers, digital automotive platforms, and private sellers competing across certification programmes, transparent pricing, and financing options. Key players in the market include BMW Group, Carma, CARS24, CAR Group Limited, Only Sales Limited, and Nine Entertainment Company. The market presents significant opportunities in the growing EV pre‑owned segment and digital transformation. The market research report provides a comprehensive analysis of the competitive landscape, including market structure, key player positioning, top winning strategies, competitive dashboard, and company evaluation quadrant.
REGIONAL ANALYSIS
- Australia Capital Territory and New South Wales lead with a combined 35.7% share, underpinned by high population density and strong digital platform adoption.
- Victoria and Tasmania follow at 24.6%, supported by strong automotive market activity.
- Queensland holds 18.9% share, driven by the state's growing population and automotive demand.
- Western Australia accounts for 11.0%, with steady growth in used car transactions.
- Northern Territory and Southern Australia represent 9.8% of the market.
RECENT INDUSTRY DEVELOPMENTS
- 2025 Activity: The Australia used car market continued its strong growth trajectory from USD 85.54 Billion in 2025 to USD 217.42 Billion by 2034.
- 2025 Activity: Digital automotive platforms continued to expand, formalising private transactions and increasing consumer trust.
- 2025 Activity: Growing acceptance of electric and hybrid pre‑owned vehicles emerged as a key structural driver through 2034.
Note: If you need any specific information that is not covered currently within the scope of the report, we will provide the same as a part of customization.
https://www.imarcgroup.com/request?type=report&id=21959&flag=C
Report Format, Delivery, and Customization Details
Report Format Mode: PPT, PDF, and Excel
Report Delivery Mode: Online Delivery, Physical Delivery
Report Delivery Time: Report Delivered Over Email within 24 to 48 hours. If requested by the client, a physical copy will be delivered within three to ten days.
Report Confirmation Mode: Yes via Email
Report Customization Mode: Yes via Email / Call
Report Table of Content: Yes
Report List of Figures: Yes
Report Methodology Mode: Yes
Request For Sample Report: Yes
What's Your Reaction?