


Australia Power Market 2026 | Worth 385.5 TWh by 2034
Australia power market reached 285.7 TWh in 2025 and is projected to reach 385.5 TWh by 2034, growing at a compound annual growth rate (CAGR) of 2.98% during 2026‑2034.
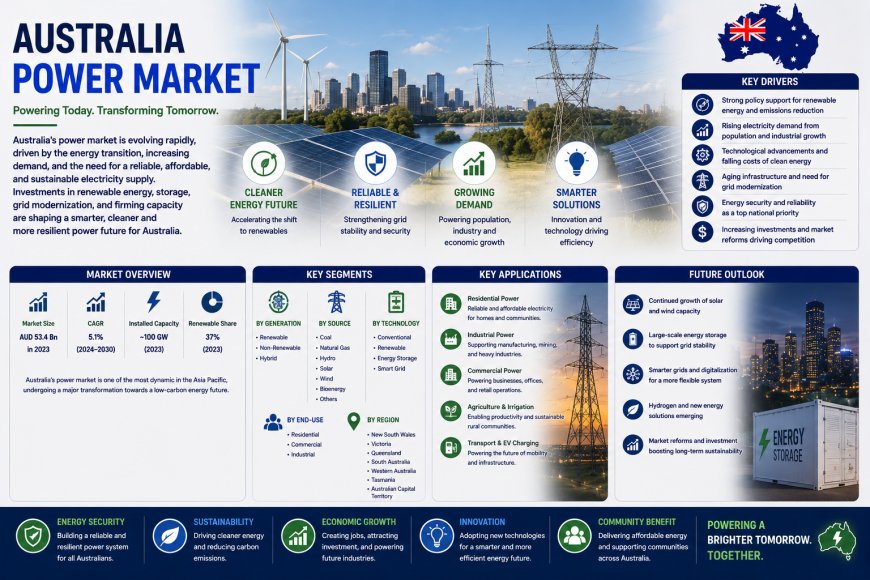


Market Overview
The Australia power market reached 285.7 TWh in 2025 and is projected to reach 385.5 TWh by 2034, growing at a compound annual growth rate (CAGR) of 2.98% during 2026‑2034. Australia’s legally binding 82% renewable electricity target by 2030, electrification of transport and industry driving demand growth, record utility-scale solar and wind capacity additions, large-scale battery energy storage system (BESS) deployment firming the grid, and the Snowy 2.0 pumped hydro completion pipeline collectively anchor the market’s steady growth. Power generation source dominates at 67.8% of the market, while Australia Capital Territory & New South Wales commands 34.1% of the regional market share.
This market is strategically important to Australia's energy transition and economic resilience, supporting the nation’s shift toward a low-carbon future. During January to June 2025, Australians had installed a total of 26.8 GW of rooftop solar capacity across 4.2 million homes and small businesses, creating a generation system where midday solar output frequently exceeds 50% of total National Electricity Market (NEM) demand.
The Australia power market is poised for sustained expansion, driven by renewable energy integration, electrification of transport and industry, and grid modernisation. With a projected CAGR of 2.98% through 2034, the market presents significant opportunities for investors focusing on utility‑scale renewables, battery storage, and smart grid infrastructure.
AUSTRALIA POWER MARKET SUMMARY
- The Australia power market encompasses electricity generation, transmission, and distribution across the National Electricity Market (NEM) and connected grid systems, serving residential, commercial, and industrial consumers across the nation.
- The ecosystem spans electricity generators (renewable and fossil-fuel based), transmission network operators, distribution network service providers, electricity retailers, and regulatory bodies.
- Power generation source dominates the market with a share of 67.8% in 2025, encompassing all electricity generated and dispatched within Australia's connected grid systems.
- Power transmission and distribution accounts for 32.2% of the market, representing the regulated network infrastructure that delivers generation to consumers.
- Australia Capital Territory & New South Wales leads regionally at 34.1% in 2025, through Sydney's massive load and NSW's renewable transition infrastructure investment.
- The market expanded from 246.7 TWh in 2020 to 285.7 TWh in 2025, anchored at 330.8 TWh in 2030.
PORTER'S FIVE FORCES ANALYSIS – AUSTRALIA POWER MARKET
The competitive dynamics of the Australia power market can be analysed using Porter's Five Forces framework.
Bargaining Power of Suppliers – Moderate
- Power generators rely on suppliers of fuel (coal, gas), renewable energy equipment, and grid infrastructure components. The global nature of equipment supply chains provides multiple sourcing options. However, the specialised nature of large-scale generation equipment gives established suppliers moderate leverage.
Bargaining Power of Buyers – Moderate
- Large industrial and commercial consumers represent concentrated buyer segments that negotiate volume‑based contracts with electricity retailers. Residential consumers benefit from retail competition in deregulated markets, with the ability to compare and switch between retailers.
Threat of New Entrants – Moderate
- Significant capital requirements for power generation facilities, grid connection, and regulatory approvals create barriers. However, declining costs of renewable energy technologies and supportive government policies have enabled new players to enter the market with solar, wind, and battery storage projects.
Threat of Substitutes – Low
- Distributed generation (rooftop solar) and off-grid solutions represent partial substitutes, but the scale and reliability requirements of the national electricity market ensure the continued relevance of the centralised power system.
Competitive Rivalry – Moderate to High
- The market features competition among electricity generators, retailers, and renewable energy developers. Competition is driven by generation efficiency, retail pricing, customer service, and renewable energy credentials.
Request for Sample Report: https://www.imarcgroup.com/australia-power-market/requestsample
MARKET GROWTH DRIVERS
Renewable Energy Integration and Policy Support
Australia's legally binding 82% renewable electricity target by 2030 is driving investment in new generation capacity, transmission infrastructure, and energy storage solutions. Record utility-scale solar and wind capacity additions, combined with large-scale battery energy storage system (BESS) deployment, are firming the grid and supporting the transition.
Electrification of Transport and Industry
The electrification of transport, industrial process heat decarbonization, and green hydrogen production are driving generation capacity and output above the current trajectory. Power generation source grows at ~3.2% CAGR, faster than the overall market.
Grid Modernisation and Infrastructure Investment
Power transmission and distribution grows at ~2.5% CAGR as regulated asset base expansion translates to service revenue growth, despite per-unit distribution cost reductions from smart grid efficiency improvements. The Snowy 2.0 pumped hydro completion pipeline further anchors the market's steady growth.
AUSTRALIA POWER MARKET SEGMENTATION
Segmentation analysis provides a detailed view of the Australia power market by category:
- Generation Source Insights: Power Generation Source – 67.8% share in 2025, Power Transmission and Distribution – 32.2% share.
- Regional Insights: Australia Capital Territory & New South Wales – 34.1% share in 2025, Victoria & Tasmania, Queensland, Northern Territory & Southern Australia, Western Australia.
COMPETITIVE LANDSCAPE
The competitive landscape of the Australia power market features a mix of electricity generators, retailers, and renewable energy developers. The market is undergoing its most consequential structural transformation since electrification began. Key participants include major electricity generation companies, renewable energy developers, and energy retailers. Investment opportunities exist in utility‑scale renewable energy generation, battery storage systems, grid infrastructure, and smart grid technologies.
REGIONAL ANALYSIS
- Australia Capital Territory & New South Wales commands 34.1% of the regional market share, through Sydney's massive load and NSW's renewable transition infrastructure investment.
- Victoria benefits from Melbourne's strong industrial base and growing renewable energy integration.
- Queensland sees significant power demand driven by the state's growing population, resource sector, and industrial activity.
- Western Australia experiences steady growth supported by Perth's expanding population and resource sector electricity requirements.
- Northern Territory & Southern Australia, though smaller in market share, are benefiting from renewable energy projects and improving grid connectivity.
RECENT INDUSTRY DEVELOPMENTS
- 2025 Activity: During January to June 2025, Australians installed a total of 26.8 GW of rooftop solar capacity across 4.2 million homes and small businesses.
- 2025 Activity: The Australia power market expanded from 246.7 TWh in 2020 to 285.7 TWh in 2025, anchored at 330.8 TWh in 2030.
- 2025 Activity: Large-scale battery energy storage system (BESS) deployment continued to firm the grid, supporting renewable energy integration.
Note: If you need any specific information that is not covered currently within the scope of the report, we will provide the same as a part of customization.
Browse Full Report with TOC & List of Figures for In‑Depth Market Insights:
https://www.imarcgroup.com/request?type=report&id=28786&flag=C
ABOUT US
IMARC Group is a global management consulting firm that helps the world’s most ambitious changemakers to create a lasting impact. The company provides a comprehensive suite of market entry and expansion services. IMARC offerings include thorough market assessment, feasibility studies, company incorporation assistance, factory setup support, regulatory approvals and licensing navigation, branding, marketing and sales strategies, competitive landscape and benchmarking analyses, pricing and cost research, and procurement research.
CONTACT US
IMARC Group
134 N 4th St., Brooklyn, NY 11249, USA
Email: sales@imarcgroup.com
Tel No: (D) +91 120 433 0800
United States: +1 201 971 6302
What's Your Reaction?