































Australia E‑Commerce Market 2026 | Worth USD 1,683.9 Billion by 2034
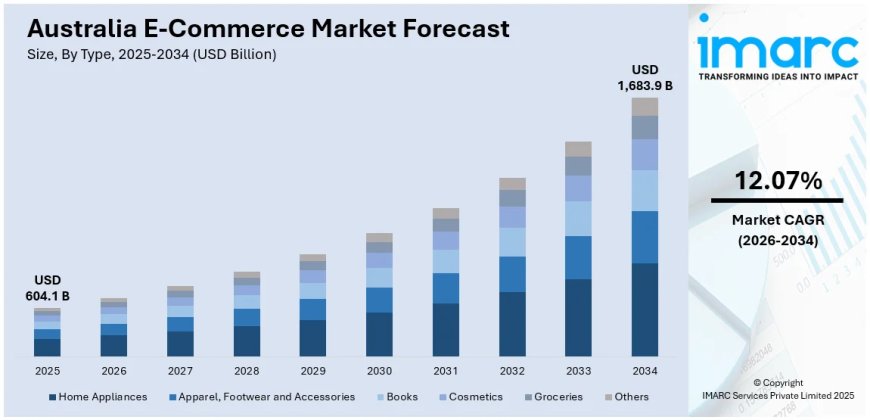
Australia E‑Commerce market size was valued at USD 604.1 Billion in 2025 and is projected to reach USD 1,683.9 Billion by 2034, exhibiting a compound annual growth rate (CAGR) of 12.07% from 2026‑2034

Market Overview
The Australia e‑commerce market is witnessing strong growth driven by rising smartphone adoption for convenient anytime‑anywhere purchasing, integration of artificial intelligence (AI) for personalised shopping experiences, and a growing preference for digital payment solutions. The market size was valued at USD 604.1 Billion in 2025 and is projected to reach USD 1,683.9 Billion by 2034, exhibiting a compound annual growth rate (CAGR) of 12.07% from 2026‑2034. The ability of AI to recommend products based on individual browsing history delivers a truly customised shopping experience, while digital wallets enable contactless and instant payments, reducing traditional friction associated with credit cards and bank transfers. This market is strategically important to Australia’s digital economy, supporting millions of businesses, creating employment, and driving innovation across logistics, fintech, and retail sectors.
AUSTRALIA E‑COMMERCE MARKET SUMMARY
- The Australia e‑commerce market encompasses the full spectrum of online buying and selling of goods and services, including business‑to‑consumer (B2C), business‑to‑business (B2B), and consumer‑to‑consumer (C2C) transactions.
- The ecosystem spans e‑commerce platforms, payment gateways, logistics providers, digital marketing agencies, and technology enablers that facilitate secure and efficient online transactions.
- Major segments identified in the e‑commerce industry include type (home appliances, apparel, footwear and accessories, books, cosmetics, groceries, and others), transaction (business‑to‑consumer, business‑to‑business, consumer‑to‑consumer, and others), and region (Australia Capital Territory & New South Wales, Victoria & Tasmania, Queensland, Northern Territory & Southern Australia, Western Australia).
- Business‑to‑consumer (B2C) represents a major segment as it offers convenient access to a massive range of products through web‑based commerce platforms, with discounts, loyalty programs, and fast delivery options further attracting buyers.
- Home appliances are a leading category, driven by convenience, low prices, and door‑to‑door deliveries, with online portals providing extensive product comparisons and customer reviews.
- Australia Capital Territory & New South Wales holds a notable market share, driven by a tech‑savvy population, strong internet penetration, and Sydney’s status as a commercial hub.
PORTER’S FIVE FORCES ANALYSIS – AUSTRALIA E‑COMMERCE MARKET
The competitive dynamics of the Australia e‑commerce market can be analysed using Porter’s Five Forces framework.
Bargaining Power of Suppliers – Moderate to High
- E‑commerce platforms rely on technology providers, payment gateways, and logistics partners. The rapid growth of AI, machine learning, and augmented reality (AR) solutions has increased the leverage of specialised technology suppliers.
- However, multiple sourcing options across cloud services, payment processors, and delivery networks help moderate supplier influence.
Bargaining Power of Buyers – High
- Australian consumers benefit from extensive choice across multiple e‑commerce platforms, price comparison tools, and access to international retailers, strengthening buyer negotiating power through competitive pricing dynamics.
- Social media and influencer‑driven discovery have made consumers more informed and selective, with easy switching between platforms.
Threat of New Entrants – Moderate
- Significant capital requirements for platform development, logistics infrastructure, brand building, and customer acquisition create moderate barriers.
- However, niche entrants focusing on eco‑friendly products, specialty items, or subscription models are successfully accessing the market with differentiated propositions, supported by social media marketing and direct‑to‑consumer models.
Threat of Substitutes – Low
- Traditional brick‑and‑mortar retail remains a partial substitute, but the convenience, wider selection, and competitive pricing of online shopping continue to drive channel shift.
- The rise of social commerce and live‑selling features embedded within platforms further reduces substitution pressure by enhancing engagement and trust.
Competitive Rivalry – High (Healthy)
- The market features intense competition among global platforms (Amazon, eBay, Temu, Shein), local omnichannel retailers (Woolworths, Coles), and specialty online brands.
- Competition is driven by delivery speed, pricing, product range, user experience, and customer loyalty programs rather than purely price‑based rivalry.
Request for Sample Report: https://www.imarcgroup.com/australia-e-commerce-market/requestsample
MARKET GROWTH DRIVERS
Rising Smartphone Adoption and Mobile Commerce Growth
Several key factors are propelling market growth in the Australia e‑commerce market. The growing reliance on smartphones for purchasing goods allows users to shop anytime and from anywhere, driving mobile commerce expansion. The proliferation of mobile apps and mobile‑optimised websites simplifies online shopping, while mobile payment solutions streamline transactions with fast, secure options that do not require sensitive credit card details. The IMARC Group’s report predicts the Australia smartphone market will exhibit a CAGR of 1.60% during 2024‑2032, further reinforcing mobile shopping momentum. This growing reliance on mobile shopping significantly impacts the Australia e‑commerce market share, driving expansion across diverse sectors including fashion, home appliances, and groceries.
AI Integration and Personalised Shopping Experiences
The integration of AI and machine learning (ML) is transforming the shopping concept, with algorithms recommending individual products based on browsing behaviour, resulting in a customised shopping experience that increases conversion rates. AI chatbots serve instant customer support, enhancing service quality while reducing waiting times. Augmented reality (AR) offers the opportunity to “try” products such as clothes, accessories, and furniture before purchase, enabling improved customer relations, minimised returns, and maximised sales. The IMARC Group’s report predicts the Australia artificial intelligence market will exhibit a CAGR of 15.80% during 2024‑2032, underlining the technology’s growing role in shaping e‑commerce operations and consumer engagement.
Social Media Influence and Social Commerce Expansion
The rise of social media is contributing significantly to the growth of e‑commerce, with most businesses using Instagram, Facebook, and TikTok as primary marketing tools. Social media allows brands to directly contact customers, create awareness, and build communities. By posting images, streaming videos, and communicating with audiences live, businesses demonstrate products in real time, drawing attention and driving traffic to virtual stores. The rise of social commerce is another key development, with platforms incorporating direct shopping features such as Instagram shopping tools, making product discovery and purchase seamless.
Subscription Models and Niche Product Opportunities
Subscription‑based shopping is increasingly favoured by Australian consumers, particularly in groceries, personal care, health supplements, and pet supplies. Brands such as Who Gives A Crap (toilet paper), HelloFresh (meal kits), and PetCircle (pet supplies) have cultivated strong customer loyalty with flexible subscription options, discounts, and personalised recommendations. Additionally, Australians are increasingly seeking niche and specialty products that cater to unique tastes or requirements. Online platforms enable niche brands to connect with specific audiences without the costs of physical retail spaces, while social media channels make it easier for these brands to create community and trust. Consumers are attracted to product narratives, authenticity, and distinct offerings.
AUSTRALIA E‑COMMERCE MARKET SEGMENTATION
Segmentation analysis provides a detailed view of the Australia e‑commerce market by category:
- Type Insights: Home Appliances, Apparel, Footwear and Accessories, Books, Cosmetics, Groceries, Others.
- Transaction Insights: Business‑to‑Consumer, Business‑to‑Business, Consumer‑to‑Consumer, Others.
- Regional Insights: Australia Capital Territory & New South Wales, Victoria & Tasmania, Queensland, Northern Territory & Southern Australia, Western Australia.
COMPETITIVE LANDSCAPE
The competitive landscape of the Australia e‑commerce market is highly dynamic, featuring intense rivalry among global platforms, local omnichannel retailers, and specialty online brands. The market is shaped by continuous investment in logistics infrastructure, AI‑driven personalisation, social commerce integration, and customer loyalty initiatives. The Australia digital payment market reached USD 118.0 Billion in 2024, with digital payment adoption a prominent factor driving the industry as it offers individuals a secure, convenient, and smooth means of shopping. New forms of digital wallets are allowing Australians to use contactless and instant payments for all online purchases, reducing hindrances associated with traditional payment methods.
Strategic developments are shaping the competitive arena. Global e‑commerce platform eBay acquired fashion C2C business Depop from Etsy for US1.2billion(approximatelyAU1.2billion(approximatelyAU1.7 billion) in February 2026, as Depop’s monthly website visits in Australia exceeded 2.5 million. Semrush data showed eBay reached 27.99 million views in Australia in January 2026, making it the fifth most‑visited retail website in the country. Meanwhile, Amazon has strengthened its position, with total retail activity across its Australian marketplace estimated at AUD 6.2 billion, representing annual growth of 26.5%, and Amazon now holds 7.5% of Australia’s online retail market. Amazon advertising revenue in Australia rose 62% year‑on‑year in 2025, reaching an estimated USD 392 million. The market also sees strong presence from Temu, which had 5 million Australian shoppers in 2025 (up 17% year‑on‑year), and Shein, which had 2.9 million shoppers (up 28% year‑on‑year).
REGIONAL ANALYSIS
- Australia Capital Territory & New South Wales holds a notable market share, characterised by high levels of e‑commerce shopping due to a tech‑savvy population and strong internet penetration. Sydney serves as a commercial hub driving demand among affluent individuals, with established logistics networks supporting online shopping.
- Victoria & Tasmania leads the e‑commerce market because of its massive consumer base and tech‑friendly culture. Increasing interest in online shopping for niche products such as organic goods supports Tasmania’s market expansion. The region’s investment in innovation and sustainability further supports e‑commerce growth.
- Queensland experiences high e‑commerce demand driven by rising population and urban landscape expansion in areas such as Brisbane, increasing demand for groceries, homeware, and lifestyle products supported by improved delivery and marketing campaigns.
- Western Australia benefits from growing digital adoption and improving delivery infrastructure.
- Northern Territory & Southern Australia see growing e‑commerce reach due to increased internet access and digitisation. People living in remote areas benefit from online shopping platforms to purchase daily essentials, while urban centres continue to drive volume.
RECENT INDUSTRY DEVELOPMENTS
- May 2026: Australia Post released its eCommerce Report revealing Australians spent a record 82.6billiononlinein2025,up1482.6billiononlinein2025,up1419 billion (23% of total online spend).
- March 2026: Amazon Business introduced Business Credit Account, an invite‑only invoicing solution giving eligible Australian businesses buy‑now‑pay‑later net payment terms, expanding flexible payment options for B2B e‑commerce.
- February 2026: eBay announced the acquisition of fashion C2C marketplace Depop from Etsy for US1.2billion(approx.AU1.2billion(approx.AU1.7 billion). Depop had over 2.5 million monthly website visits in Australia in January 2026, and eBay recorded 27.99 million views in Australia, ranking as the fifth most‑visited retail website.
- February 2026: The Australia Post eCommerce Report highlighted that millennials remain the largest cohort of online spenders at $29.7 billion, while older groups recorded some of the fastest growth rates. Western Australia and Queensland led spending growth, supported by strong income growth and resilient labour markets.
- August 2025: Australia Post opened a new 18,360m² parcel delivery centre in Blacktown, Western Sydney, designed to deliver up to 30,000 parcels per day (48,000 during peak periods). The facility features a 398kW solar system, battery storage, EV charging stations, and is targeting a 5 Star Green Star rating, projected to reduce carbon emissions by over 250 tonnes annually.
- 2025 Activity: Amazon’s total retail activity across its Australian marketplace reached an estimated AUD 6.2 billion, representing annual growth of 26.5%. Amazon now holds 7.5% of Australia’s online retail market and reaches 8.8 million active shoppers. Amazon advertising revenue in Australia rose 62% year‑on‑year in 2025 to an estimated USD 392 million.
Note: If you need any specific information that is not covered currently within the scope of the report, we will provide the same as a part of customization.
https://www.imarcgroup.com/request?type=report&id=21967&flag=C
ABOUT US
IMARC Group is a global management consulting firm that helps the world’s most ambitious changemakers to create a lasting impact. The company provides a comprehensive suite of market entry and expansion services. IMARC offerings include thorough market assessment, feasibility studies, company incorporation assistance, factory setup support, regulatory approvals and licensing navigation, branding, marketing and sales strategies, competitive landscape and benchmarking analyses, pricing and cost research, and procurement research.
CONTACT US
IMARC Group
134 N 4th St., Brooklyn, NY 11249, USA
Email: sales@imarcgroup.com
Tel No: (D) +91 120 433 0800
United States: +1 201 971 6302
What's Your Reaction?